
FACEBOOK – getting close to support of a Channel Up
FACEBOOK is moving towards the support line of a Channel Up. Because we have seen it retrace from this line before, we could see either a break through this line, or a rebound back to current levels. It has touched this line numerous times in the last 12 days and may test it again within […]

Should we expect a breakout or a rebound on US Small Cap 2000 Index?
The movement of US Small Cap 2000 Index towards 2263.9700 price line is yet another test of the line it reached numerous times in the past. We expect this line test to happen in the next 10 hours, but it is uncertain whether it will result in a breakout through this line, or simply rebound […]
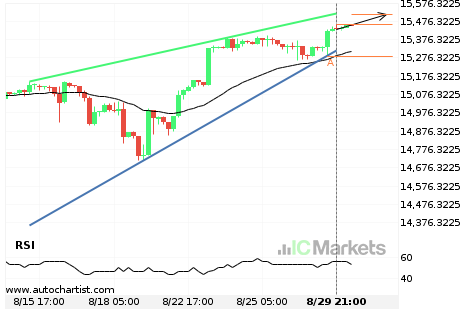
Either a rebound or a breakout imminent on US Tech 100 Index
US Tech 100 Index is heading towards the resistance line of a Rising Wedge. If this movement continues, we expect the price of US Tech 100 Index to test 15510.9000 within the next 3 days. But don’t be so quick to trade, it has tested this line numerous times in the past, so this movement […]

Either a rebound or a breakout imminent on US Tech 100 Index
US Tech 100 Index is heading towards the resistance line of a Rising Wedge. If this movement continues, we expect the price of US Tech 100 Index to test 15387.3000 within the next 3 days. But don’t be so quick to trade, it has tested this line numerous times in the past, so this movement […]

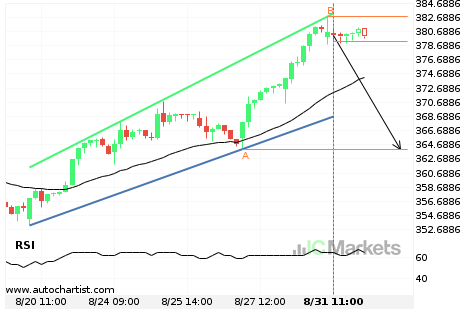
Will US Wall Street 30 Index have enough momentum to break resistance?
US Wall Street 30 Index is heading towards the resistance line of a Rising Wedge and could reach this point within the next 2 days. It has tested this line numerous times in the past, and this time could be no different from the past, ending in a rebound instead of a breakout. If the […]
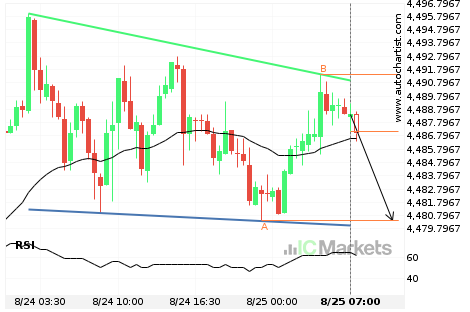
Will US SPX 500 Index have enough momentum to break support?
US SPX 500 Index is heading towards the support line of a Descending Triangle and could reach this point within the next 8 hours. It has tested this line numerous times in the past, and this time could be no different from the past, ending in a rebound instead of a breakout. If the breakout […]
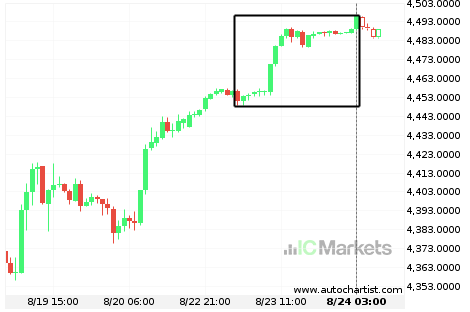
What’s going on with US SPX 500 Index?
Those of you that are trend followers are probably eagerly watching US SPX 500 Index to see if its latest 1% move continues. If not, the mean-reversion people out there will be delighted to cash in on this exceptionally large 2 days move.

Huge bullish move on US Wall Street 30 Index
US Wall Street 30 Index has moved higher by 1.63% from 34,790.4 to 35,250 in the last 4 days.

Should we expect a breakout or a rebound on US Wall Street 30 Index?
The movement of US Wall Street 30 Index towards the resistance line of a Triangle is yet another test of the line it reached numerous times in the past. We expect this line test to happen in the next 12 hours, but it is uncertain whether it will result in a breakout through this line, […]
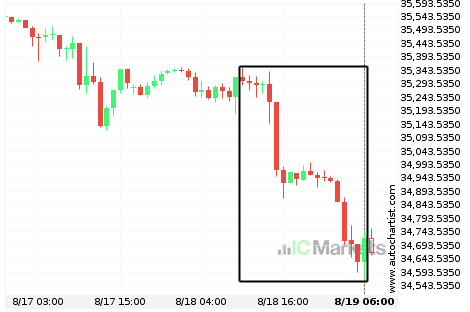
Huge bearish move on US Wall Street 30 Index
US Wall Street 30 Index has moved lower by 1.65% from 35,316.5 to 34,718.1 in the last 20 hours.